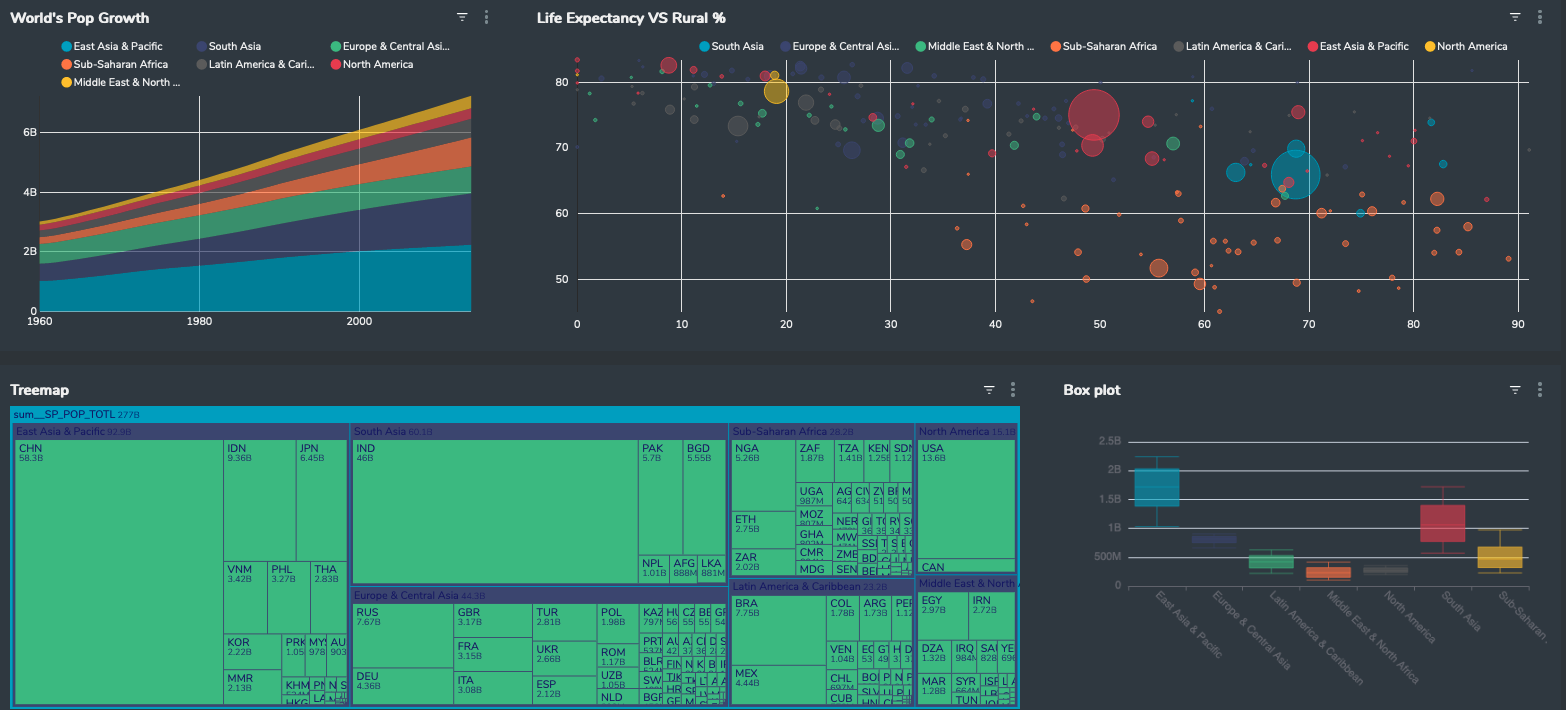
Data visualization platform for data- driven decisions

Create and Analyze data in a matter of a few clicks, feature-rich exploration and intuitive visualization platform and built on top of Apache business intelligence products
Screen shot 2022 11 16 at 5.51.09 pm
Device frame

Rich and varied visualization options

Ships with a wide array of beautiful chart types and visualizations to create insightful dashboards. Gives everyone the ability to quickly and easily integrate and explore data.
visualize

Visualize and draw insights from dashboards in a few clicks

Create visually appealing dashboards that are presentation-ready in a matter of clicks and help formulate actionable insights across the organization.
visualize

SQL Powerhouse

Powerful IDE to query a database which is great for exploratory data analysis. Acts as a solid playground from which one can slice and dice the dataset in many ways to arrive at a form that needs to be visualized to solve the analytical questions that the chart was created to answer. The platform also provides the ability to save queries and see query history.
visualize

Join Our Analytics Community

Sign up to our list to be the first to get access.

Additional Enterprise-grade Features

  • Top-notch Modern BI

    • High-quality Data Visualizations
    • Over 30+ types of visualizations
    • share and collaborate on dashboards
  • Ease of use

    • Interface is simple
    • Requires no special expertise to navigate
    • Easy tool for exploring datasets & developing charts
  • Many Use cases

    • Visualize data distributions
    • Finding trends in time series or multi-feature datasets
    • Discover hierarchical and graphical relationships

Tons of Data Connectors

Instantly kick off your analytics journey by connecting to popular databases, in just a few clicks. Auto sync and unify data across different data warehouses to build your ad hoc reports and dashboards to suit the business needs in minutes not months
Screenshot 2022 11 30 181350
Device frame

Why experts prefer and love us?

 Dendrite enhances the productivity of any researcher and truly accelerates end to end business intelligence and statistical learning and enables data-driven decisions. 

  • "Dendrite was worth a fortune to my small quant fund by allowing us to do both business intelligence and machine learning all in one platform. Helped save us time and iterate fast with our research. "

    Quant Trader/Researcher
  • "Dendrite is both attractive and highly adaptable for machine learning and business intelligence. I didn't even need training. Repetitive tasks in statistical learning can be done with point and click which allows me to focus on the finance literature and actual research."

    Professor - Finance
  • "It's really wonderful to be able to do ML & BI in one integrated place. Needless to say we are extremely satisfied with the results. Very easy to use and no limits on number of predictions, models or size of data is great. "

    Software engineer

Dendrite makes data-driven decisions simpler, faster, and better!

 Download Dendrite and experience the future of statistical learning in research